While controllable electricity demand is a benefit of green hydrogen production, aggressive price-responsive electrolysis puts equipment under operational stress and makes hydrogen delivery more complicated. This study proposes a degradation-aware co-optimization framework that connects proton-exchange-membrane (PEM) electrolyser efficiency, start-up and ramping, renewable procurement, hydrogen storage, and electricity charges. A reproducible mixed-integer model is used to compare the operation of a hypothetical 10 MW plant under Bangladesh's documented 2024 industrial tariff, with the operation of the plant under three different scenarios: inflexible, degradation-agnostic, and degradation-aware. All strategies produce 3,461.54 kg per day. Degradation-aware operation decreases peak grid withdrawals by 41.7% compared to unrestricted flexibility, and reduces the assumed wear-exposure index by 44.54% compared to unrestricted flexibility, but its illustrative operating margin is slightly lower. Twenty-seven factorial scenarios are used to identify conditions that change economic rankings. The results clearly separate the measurable tariff incentives from unverifiable lifetime, carbon, and grid-service incentives. Integrated dispatch offers a clear evaluation approach, and investment decisions need calibrated degradation measurements, renewable sourcing verification, and market-specific settlement data. Plant trials are still required before deployment.
Research ArticleGreen Hydrogen and Power MarketsIn progress
Green Hydrogen as A Grid-Flexibility Resource: Degradation-Constrained Co-Optimization from Electrolyser Physics to Power Markets
Correspondence: rahmanshahriyar0048@gmail.com
Abstract
Keywords green hydrogenPEM water electrolysisdegradation-aware co-optimizationhydrogen storageelectricity-market participationgrid flexibility
1. Introduction
Industrial demand is evolving as a consequence of the growth of VRE. Historically, production throughput-driven processes are under pressure to adapt their consumption to the availability, cost, and carbon footprint of electricity. Water electrolysis is a special case, as electrical energy is converted into a transportable industrial product instead of being used as final energy. This sector coupling pathway creates a potential connection between renewable generation, industrial hydrogen demand, and balancing in the electricity system. (Buttler & Spliethoff, 2018; Staffell et al., 2019). But deliverable flexibility is not guaranteed by the mere presence of an electrolyser. Whether an operator really moves load in a useful direction depends on the schedule, the conversion efficiency, hydrogen storage, offtake conditions, and grid-interconnection rules. (Glenk & Reichelstein, 2019; Rabiee et al., 2021).
Although electricity procurement is the highest variable cost of electrolytic hydrogen, the lowest-cost procurement schedule may focus hydrogen production on a small window of time. Lower operating hours lead to lower utilization, higher dependence on hydrogen storage, and more frequent start/stop cycles or rapid setpoint changes. System studies have shown that it is important to consider the location of hydrogen production and its impacts on the power sector together, not as a standalone electrolyser capacity (Stöckl et al., 2021). The operational issue is thus a physical one: the mechanical and electrochemical load on the production asset is altered by moving electrical demand to low-cost or renewable times. If there is no durability state or constraint, minimizing the price of the product may lead to a future maintenance or stack replacement cost (Papakonstantinou et al., 2020).
Proton-exchange-membrane (PEM) electrolysis is appealing for flexible operation because it responds to the electrical signal more quickly than many of the traditional industrial processes. However, dynamic controllability does not mean that the system can be controlled for an unlimited period of time. The load changes affect the cell voltage, the conditions of the electrodes and membranes, the gas crossover, and the behaviour of the BOP, which varies depending on the technology and operating environment (Lange et al., 2023; Sayed-Ahmed et al., 2024; Wang et al., 2024). Likewise, hourly renewable consumption does not qualify for low-carbon hydrogen unless the electricity source and the temporal matching requirements are proven. Research on hydrogen procurement and grid-related emissions has shown that environmental additionality and dispatch flexibility are two different facets of performance (Giovanniello et al., 2024; Ricks et al., 2023; Ruhnau & Schiele, 2023).
The financial opportunity for an electrolyser is dependent on the institutional structure of electricity pricing, and a geographically based evaluation is important. The case of Bangladesh is illustrative of emerging markets. Local hydrogen assessments have been published, which set a baseline for the technology, but do not create a working merchant market for the bidding of electrolyser technology (Salam et al., 2024). Rather, the historical high-tension industrial tariff that takes effect in February 2024 provides an observable signal and a peak/off-peak electricity purchase signal. In this tariff, the representative load will be charged Tk 9.69/kWh outside the peak period and Tk 13.47/kWh during the peak period. These charges are not a series of Bangladesh hourly wholesale or reserve-market prices, but rather charges documented historically that support an internally consistent counterfactual dispatch experiment.
The present study builds on the tariff-based case by combining load-dependent conversion, an explicit hourly hydrogen delivery requirement, finite gas storage, local PV generation, and a separately priced wear-exposure proxy, to address these coupled constraints. These additions are necessary to prevent three analytical shortcuts. First, if the performance is constant, part-load and high-load penalties are not apparent. Secondly, a set daily electricity target does not ensure hydrogen delivery at a specific time. Third, restricting the movement of loads does not give a consistent comparison between the different strategies, because the operating costs of the changes are not valued. Other hydrogen deployment studies highlight the need to scale barriers that continue to limit the realization of the system value of attractive single-day schedules (Odenweller et al., 2022; Shih et al., 2022).
The research question is not whether it is technically feasible to use flexible electrolysis, but whether the trajectory is still appealing when the technical constraints, producer economics, and hydrogen delivery are all taken into account. The study is based on three questions. RQ1 investigates the relationship between PEM efficiency, minimum load, transitions, and degradation exposure and technical flexibility. RQ2 investigates the impact of degradation-constrained co-optimization on contribution margin, delivery compliance, and a transparently bounded lifetime-exposure indicator. RQ3 seeks to understand how the relative economic and peak-grid performance of inflexible, unrestricted, and wear-aware operation is affected by electricity prices, renewable availability, and hydrogen obligations. The related objectives are RO1: Represent operating physics and degradation; RO2: Co-optimize dispatch, market-facing procurement, hydrogen production and delivery; and RO3: Quantify economic, operational and grid outcomes for controlled scenarios.
The delivery obligation and system boundary are the same for each contrast. The contribution is not a measure of a commercial hydrogen market, but a mechanism test of the inspection. Historical tariffs are separated from assumed solar and commercial parameters, the same hydrogen-delivery constraint is applied to all competing decisions, and a 27-case scenario factorial reveals conditions under which the rankings flip-flop. This separation is crucial for publication-quality inference: modelled peak reduction is not independently verified congestion relief, and a dimensionless wear index is not measured stack life. The resulting framework provides an operational benchmark that can be validated in the future with plant-specific testing, renewable-generation records and formal electricity-market settlement data.
An apparent savings from supplying customers from unrecorded initial gas stocks is also not allowed by an explicit inventory constraint. This protection maintains consistency of operating rules.
2. Literature Review
2.1 Electrolyser conversion physics and representation in dispatch models
The loading response of electrochemical conversion is nonlinear due to the fact that the contributions of activation, ohmic, mass-transport, and auxiliary energy are not constant over an operating envelope. There is a significant difference between alkaline, PEM, and other electrolysis technologies in terms of minimum stable load, thermal dynamics, gas purity, and response time (Martinez Lopez et al., 2023; Shih et al., 2022) at the system level. A dispatch model that assumes hydrogen production is a constant fraction of electrical production is thus a good first approximation but hides the potential efficiency penalties at equipment limits. Recent scheduling reviews acknowledge the importance of piecewise or nonlinear conversion equations, especially if the power prices result in extended periods of operation at partial or maximum output (Wang et al., 2024).
There is no universal transferable PEM efficiency curve. The nameplate performance is influenced by pressure, temperature, stack design, water conditioning, and the presence of auxiliary loads. Therefore, an illustrative piecewise function is preferable to a false precision technology-independent polynomial, if the curve is assumed and calibrated. The results of the alkaline-electrolyser operation with thermal and impurity constraints demonstrate the implications of replacing conservative static operating constraints with process-specific dynamic constraints (Qiu et al., 2023). That's not to say the advance will remove the need to keep conclusions to the technology that's actually represented.
2.2 Operating transients, ageing mechanisms, and lifetime inference
Dynamic electrolysis brings in multiple interacting ageing pathways. The deterioration of the electrodes, membrane, and transport layers is affected by potential excursions, start-stop cycles, high current density exposure, temperature changes, and water management conditions (Martinez Lopez et al., 2023; Papakonstantinou et al., 2020; Sayed-Ahmed et al., 2024). Laboratory degradation syntheses warn that all starts or ramps are not the same type of damage, since the amount of damage measured will vary depending on the duty sequence and measurement protocol (Wallnöfer-Ogris et al., 2024). Reviews, however, all agree that the need to reveal transients and equipment-health issues in dispatch optimization cannot be ignored, but cannot be considered economically free aggressive load movement (Lange et al., 2023).
The concept of ageing penalties has been extended in the context of economic studies that are now also aware of durability, with the introduction of variable-power lifetime relationships and long-horizon cost calculations (Zhang & Yuan, 2022). Data-driven prognostics have also been correlated with constant-load and start-stop operating history (Xu et al., 2024). These advances show that there is a methodological gap: while the durability models are experimentally calibrated, they need to be measured in the field or laboratory for each stack; the models used for market scheduling are often missing the manufacturer degradation maps. In this context, a clear proxy index provides a controlled sensitivity analysis without a defensible conversion to real operating years, due to the lack of data.
The gap is related to the strict definition of what is being proxied and what is not being observed physically.
2.3 Price signals, electricity-market participation, and operational margins
Economic research shows that the average cost of electricity and its use, as well as the relationship between dispatch freedom and the capacity of the electrolyser, are sensitive to hydrogen production (Ghaemi et al., 2023; Glenk & Reichelstein, 2019; Walter et al., 2023). Security-constrained system modelling treats electrolysis as a dispatchable demand resource, and analyses of hydrogen supply chains show that there are spatial and temporal constraints on arbitrage-based value (Rabiee et al., 2021; Stöckl et al., 2021). However, the avoided electricity payment of a price-taking producer does not equal a welfare gain to the economy as a whole. This distinction is especially important when a regulated time-of-use tariff, as opposed to an organized hourly exchange, provides the price signal.
More sophisticated market-participation formulations include bilateral contracts, balancing procurement, hydrogen-delivery commitments, and financial risk (Rezaee Jordehi et al., 2024). Research on battery-supported electrolysers also links price-responsive operating decisions to ageing effects and short-horizon profitability (Mößle et al., 2025). These approaches have set the groundwork for the technical possibility of meaningful integration and for its representation in selected settings. The research opportunity is therefore not an imagined absence of previous co-optimization, but a building of an auditable mechanism chain for a different institutional setting, while acknowledging that real bidding, reserve payments and price uncertainty demand data other than a fixed retail tariff.
2.4 Hydrogen delivery, inventories, and intertemporal feasibility
Electricity flexibility is useful if there is a time gap between electricity generation and delivery. Hydrogen storage smooths out the peaks and valleys of these two processes, enabling a plant to store hydrogen when electricity is cheap, and to release it to a customer when electricity is expensive. Energy-system studies show that the structure of the hydrogen network, the amount of hydrogen stored, and the integration of renewables affect the costs of the producers and the benefits of the power sector (Stöckl et al., 2021; Walter et al., 2023). For dispatch models that only set the total amount of hydrogen produced per day, an hourly production shortfall is not visible even if industrial customers need continuous hydrogen production.
This leaves out of the equation the fact that peak-period shutdown is not feasible. An interpretable planning boundary is set by a material-balance constraint and an explicit cyclic terminal inventory. This type of model separates the electricity that is avoided from the hydrogen that is still delivered during the peak. It also reveals when more storage is required to maintain customer commitments. However, gaseous storage does not include compressors, purification, pressure-dependent tank capacity, leakage, and safety margins. A gas-inventory state is therefore a viable first-stage operational abstraction, rather than a complete plant-engineering specification. The dispatchable region is also influenced by site-specific compression loads, storage pressure cycles, and industrial offtake disruptions, which need specific equipment measurements.
2.5 Renewable procurement, grid claims, and the unresolved integration gap
The dispatch incentives and the environmental interpretation of electrolysis are altered with time-matched renewable procurement. The literature on temporal matching and additionality shows that there are different emissions results if the contractual renewable supply and the actual hourly consumption are separated (Giovanniello et al., 2024; Ricks et al., 2023; Ruhnau & Schiele, 2023). Local renewable absorption is not the same as system-level curtailment reduction: If the PV output is used at a modelled plant, it does not mean that the rest of the system would have curtailed those megawatt-hours. Congestion benefits are found to be dependent on feeder conditions and competing flexibility resources based on distribution-system analysis (Ghaemi et al., 2023). Together, previous studies provide support for coupled technical-economic modelling, but do not resolve an implementation context-specific question: how to implement a model that is targeted to an emerging, tariff-regulated context, while also having to include physical loading, stock-constrained hydrogen delivery, wear assumptions, and price-mediated procurement in the same auditable counterfactual? There are no generic optimization results, nor are there any unchecked claims of lifetime yield, that can be used to identify those mechanisms. The present design seeks to fill this smaller gap with clear equations, shared service commitments, scenario tests, and clear limits on market settlement, physical degradation, and renewable certification.
Table 1. Synthesises the Strands Most Relevant to The Proposed Integration, Identifying the Model Construct Retained and The Corresponding Limit of Inference.
| Research strand | Established contribution | Limit for this case | Retained mechanism |
|---|---|---|---|
| Electrolyser physics | Efficiency varies with setpoint and auxiliaries | No measured plant efficiency map | Concave piecewise throughput |
| Dynamic durability | Starts and cycling relate to stack deterioration | No site-specific voltage-loss calibration | Transparent exposure constraints |
| Price-responsive dispatch | Electricity price and utilization jointly drive cost | Retail TOU is not wholesale settlement | Hourly grid/PV procurement |
| Hydrogen storage | Inventory separates production and offtake timing | No pressure/compression subsystem | Cyclic mass-balance requirement |
| Grid/carbon outcomes | Temporal matching and network context matter | No observed marginal emissions or reserve price | Peak withdrawals and PV absorption |
The contribution thus lies in specifying operating constraints and evaluation criteria jointly, rather than claiming that previous studies ignored the individual mechanisms.
3. Conceptual and Decision Framework
The theoretical framework for studying electrolyser flexibility is a production system with physical constraints and price taking. The production system with physical constraints and price taking is a theoretical basis for studying electrolyser flexibility. Price-mediated operating opportunities are generated by market conditions; electrochemical conversion and start-up and ramping constraints are the conditions that allow for a power demand; and hydrogen delivery schedules with finite inventory impose intertemporal service obligations. The co-optimization then identifies the electricity procurement, hydrogen production, and storage actions and assigns an explicit cost to a transparent operational wear proxy. The integrated representation is inspired by system-level sector coupling (Staffell et al., 2019) and technical literature on dynamic operation and market-facing scheduling (Rezaee Jordehi et al., 2024; Zhang & Yuan, 2022).
The six stages of the conceptual framework are shown in Figure 1. It is limited by the technology and hydrogen-service stages and has historical electricity charges as its upstream conditions. The central decision stage takes into consideration operating hours, starts, high-load exposure, and absolute load movement. The economic, hydrogen, grid, and degradation-exposure results are compared for three typical service benchmarks: inflexible (A), flexible degradation-agnostic (B), and flexible degradation-aware (C).
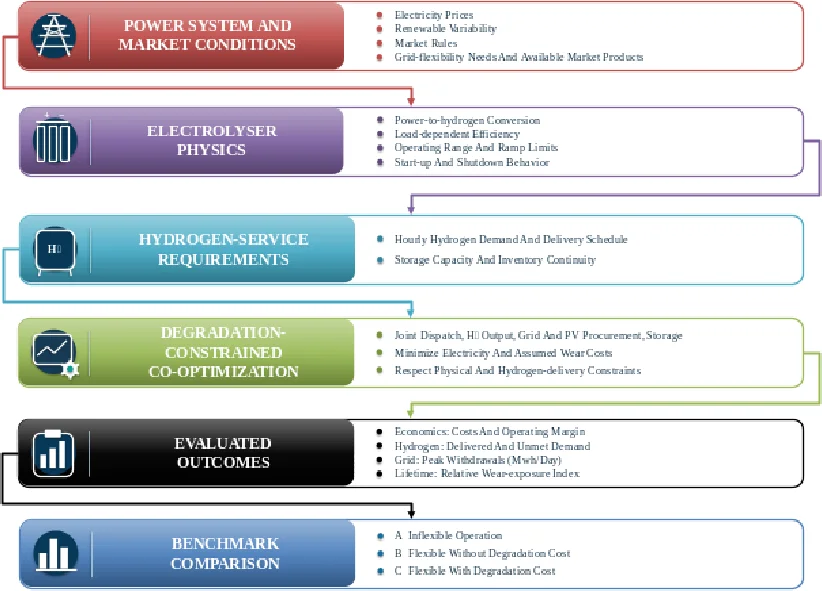
The framework includes three directional propositions. A higher peak/off-peak tariff differential is beneficial to load displacement if inventory and plant capacity are available. More restrictive operating rules reduce the physical dispatch envelope and raise or maintain the minimum procurement cost in nested feasible sets. Only when the wear penalty is reduced by the assumed wear valuation change will the optimal dispatch change. These propositions are about model interventions and not observed causal treatment effects. A calibration for each plant is still required to convert exposure to degradation or years of service. Table 2 operationalizes the framework components, relating each stage to decision variables, scenario inputs, model outputs, and explicit inference boundaries. This map does not allow for the potential market products or greenhouse-gas benefits to be shown as realized outcomes in a regulated tariff case.
Table 2. Construct, Measurement, And Identification Map for Structural Contrasts.
| Framework Component | Variables/Outcomes Represented | Input Or Model Role | Inference Boundary |
|---|---|---|---|
| Market/system | Tariff cₜ, PV availability, 17–23 grid peak | Historic tariff; assumed PV supply | No merchant bids or reserve products |
| Electrolyser physics | Pₜ, qₜ(Pₜ), yₜ, ramps, starts | Assumed PEM response and load limits | No verified vendor performance map |
| Hydrogen service | dₜ, Sₜ, tank capacity, unmet load | Fixed hourly delivery and cyclic stock | No pressure or compressor model |
| Degradation | High-load hₜ, ∑|ΔPₜ|, starts, wear index W | Assumed proxy, constrained and costed | Not measured voltage loss or years |
| Optimization decisions | Load, PV/grid purchase, qₜ, inventory | MILP decisions subject to physical limits | Retail procurement, not actual bidding |
| Economic/H₂ outcomes | Cost, conditional contribution, delivered H₂ | Computed from common service volume | Not full LCOH or investment profit |
| Grid/lifetime outcomes | Avoided 17–23 grid MWh; wear-exposure index | Primary grid and secondary wear metrics | Not curtailment, congestion or stack life |
Avoided evening grid withdrawals is the main metric for the grid, and is defined for strategy s as ΔGₛ = Σₜ₌₁₇₂₂ grid₍A, t₎ − Σₜ₌₁₇₂₂ grid₍s, t₎, in MWh per representative day. It is not a measure of congestion relief, avoided curtailment, reliability improvement, or verified balancing service, but rather of modelled peak hour demand relocation. The delivered mass and unmet demand are used to measure hydrogen performance, the conditional operating contribution after energy costs and a hypothetical wear reserve is used to measure economic value, and lifetime implications are only measured by relative exposure W and not by independent estimates of stack-life years. The producer and the grid operator have different goals, and producer margin is not interpreted as a measure of social welfare.
4. Methodology
4.1 Case, research design, and counterfactual contrasts
The study is a case study of a representative 10 MW grid-connected PEM electrolyser in Bangladesh, which is deterministic, quantitative, and optimization-based. The historical commercial signal is the February 2024 industrial tariff published by the HT, not an operating record. The nameplate capacity, delivery demand, photovoltaic opportunity, and hydrogen inventory are the same for cases A, B, and C. A has constant output, B has minimum procurement costs with no wear terms, and C co-optimizes procurement and proxy wear with conservative dynamic restrictions. These interventions detect differences in the model, rather than treatment effects in the population or measured plant behaviour.
4.2 Data provenance and explicit assumptions
The historical industrial energy charges are Tk 9.69/kWh off-peak and Tk 13.47/kWh during 17:00-23:00, which are taken from the DPDC tariff notice [https://dpdc.gov.bd/site/page/27e77af7-1187-436c-9f80-b579d3493a46/]. The 12 MWp PV source is an example of an engineering scenario, not based on downloaded irradiation measurements, with a derating of 0.82 and a smooth daylight profile. Similarly, the modelling assumptions are Tk 5/kWh for consumed PV, Tk 700/kg hydrogen revenue, a 10 MW PEM duty curve, and 1000 kg storage capacity. The monthly demand charge is not included in the tariff since the model does not have contractual metered-maximum and billing-period information. No market bids, ancillary-service offers, dispatch instructions, balancing payments, or wholesale clearing decisions are modelled; in this instance, “participation” refers to tariff-responsive electricity procurement. There is no non-journal tariff or policy source that appears in the IEEE literature reference list. PV supply is modeled as a time-indexed procurement opportunity, and no revenue is credited for unused PV supply. The model does not include feeder constraints, power-flow losses, and marginal generation emissions, which are excluded from the model boundary to avoid the risk of facility-level savings being confused with system welfare. Table 3 records the difference between the observations made in history, the assumed plant parameters, and the calculated results prior to numerical interpretation.
Table 3. Provenance and Explicitly Assumed Base-Case Numerical Inputs.
| Input | Base scenario or source | Data status | Model use |
|---|---|---|---|
| Retail electricity signal | Tk 9.69 / 13.47 per kWh; 17–23 peak | Observed historic 2024 DPDC | Grid-purchase hourly charge |
| PEM nameplate/load | 10 MW; on-state 2–10 MW | Assumption | Power and availability limits |
| PEM throughput curve | 2 MW: 37.5 kg/h; 7.5 MW: 144.23 kg/h; 10 MW: 185.19 kg/h | Assumption | Nonconstant conversion |
| Solar and purchase terms | 12 MWp PV; 0.82 derate; Tk 5/kWh PV consumed | Assumption | Renewable procurement option |
| Hydrogen delivery | 3,461.54 kg/day; Tk 700/kg sale price | Assumption | Fixed service and gross receipts |
| Hydrogen inventory | 1,000 kg tank; 500 kg cyclic start/end | Assumption | Hourly supply reliability |
| Wear valuation/policy. | Tk 200/index unit; 2.5 MW/h; high ≤12 h; starts ≤1 | Assumption | Constrained dispatch comparison |
4.3 Load-dependent PEM conversion and operating transitions
If the binary on-state yₜ is one, then the power Pₜ is between 2 and 10 MW; otherwise, it is zero. The hydrogen production envelope qₜ(Pₜ) is a concave piecewise-linear interpolation through assumed power–throughput pairs of (2, 37.5), (6, 115.38), (7.5, 144.23), (9, 172.08), and (10, 185.19), expressed in MW and kg/h. A linear hypograph requires that for each adjacent segment, qₜ ≤ aⱼPₜ+bⱼyₜ. Any production exceeding contracted deliveries is counted as waste and not allowed to be produced free of energy absorption. Starts are when the on-state switches from 0 to 1, and the absolute hourly movement includes the cyclic day boundary. Interpolation is continuous between specified nodes, but does not require an experimentally fitted electrochemical law. The conversion map is assumed constant over the scenarios, so that cumulative ageing does not affect the assumed efficiency nodes or the subsequent production capacity. This separation allows the technical calculation to be reproduced, and reveals the need for calibration.
4.4 Electricity–hydrogen procurement and material balance
Electric power equals PV use on site plus grid purchases for each hour. The PV utilizations must not exceed the availability of the PV or the electrolyser power. Hydrogen storage Sₜ is modeled as Sₜ=Sₜ₋₁+qₜ−dₜ−spillₜ, where the base delivery is 144.23 kg/h, the capacity is 0–1,000 kg, and the initial and terminal inventories are both 500 kg. The terminal constraint stops the savings from being used up by consuming an initial gas buffer without replenishment. It is a consumption-shifting measure, not a verified settlement of grid services, of the selected primary grid outcome, which is avoided by purchasing electricity between 17:00 and 23:00, while keeping the same load level as the constant-load counterfactual at the same service volume. A fixed delivery price makes it possible to separate dispatch-cost effects from the other effects of the strategies on revenue, while keeping the demand constant.
4.5 Degradation proxy and mixed-integer objective
The wear-exposure index is W=Σₜ[yₜ+4hₜ+2|Pₜ−Pₜ₋₁|+40sₜ], where hₜ indicates operation above 9 MW and sₜ indicates an off-to-on start. The coefficients are illustrative dimensionless policy weights, not estimated physical voltage-loss parameters. Case C assigns Tk 200 per index unit, caps hourly movement at 2.5 MW, limits high-load exposure to 12 hours, and permits no more than one cyclic start. Case B excludes these restrictions and assigns no wear cost in optimisation, although its realised schedule is evaluated ex post using identical proxy weights. The minimised objective comprises grid purchases, purchased PV, proxy wear, and penalised hydrogen spillage. Reported margin subtracts these costs from hypothetical hydrogen receipts; financing, investment, compression, stack replacement, and taxes remain outside scope.
4.6 Scenario design, reproducibility, and identification safeguards
A 3×3×3 full factorial varies hydrogen demand (0.8, 1.0, 1.2 of baseline), PV availability (0.4, 1.0, 1.3), and the historic tariff vector (0.8, 1.0, 1.3). These variations are alternative assumed conditions, not simulated historical years. Additional checks vary wear unit price between Tk 0 and Tk 800 and storage capacity between 250 and 1,500 kg. Linear constraints and binaries are solved through SciPy–HiGHS mixed-integer programming with a 0.1% relative optimality tolerance. Hourly power balance, daily hydrogen mass balance, tank endpoints, start accounting, and ramp feasibility are checked programmatically.
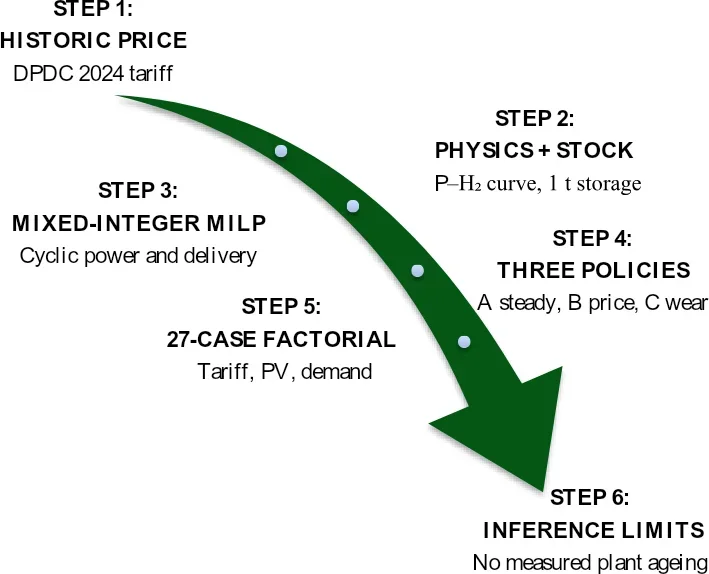
The full output is inspected for nonnegative grid procurement, valid operating states, zero unmet delivery, and identical initial and terminal inventory. The solver optimality gap describes numerical search accuracy only, not model-parameter uncertainty or field validity. The accompanying script and CSV inputs reproduce all figures and comparisons. The next validation stage requires manufacturer efficiency tests, stack-voltage measurements, half-hourly load records and verified electricity settlement terms to replace the illustrative curves and pricing assumptions. Because those observations are unavailable here, no credible statistical confidence interval, real equipment lifetime in years, emissions saving, or verified reserve-market revenue is estimated Figure 2 describes the computational sequence, showing where independently documented values end and assumed operating parameters enter the counterfactual analysis.
5. Results
5.1 Conversion efficiency and technically available flexibility (RO1)
To address RO1, the conversion analysis examines how electrolyser loading changes specific electricity consumption and, consequently, the electrical input required to meet contracted hydrogen delivery. Figure 3 plots the assumed PEM operating nodes underlying the optimisation, with MW input against kWh/kg output.
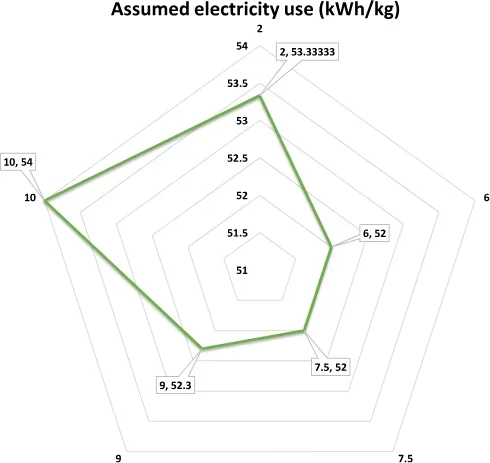
At 7.5 MW, the nominal operating point requires 52.0 kWh/kg; at 10 MW it requires 54.0 kWh/kg, while at 2 MW it requires 53.33 kWh/kg. Thus, maximum power is not identical to maximum energy-conversion efficiency. The curve makes unrestricted concentration into cheap hours less attractive than a constant-efficiency representation would suggest and generates different total electrical inputs even when daily hydrogen delivered is fixed.
5.2 Procurement economics under three operating rules (RO2)
To address RO2, the financial comparison holds hourly hydrogen delivery constant while distinguishing electricity expenditure from the hypothetical wear reserve. Table 4 reports the complete base-case procurement and margin calculations; its inclusion clarifies that the monetary results describe contribution margins, not investment returns.
Table 4. Financial comparison at identical daily hydrogen delivery.
| OPERATION | H₂ DELIVERED KG/D | ELECTRICITY COST TK/D | WEAR RESERVE TK/D | CONTRIBUTION TK/D | Δ VS A TK/D |
|---|---|---|---|---|---|
| A Inflexible | 3,461.54 | 1,636,581 | 4,800 | 781,696 | +0 |
| B Wear-Agnostic | 3,461.54 | 1,515,397 | 21,571 | 886,108 | +104,412 |
| C Wear-Aware | 3,461.54 | 1,525,678 | 12,571 | 884,827 | +103,131 |
The lowest electricity expenditure occurs with wear-agnostic optimization: Tk 1.515 million/day versus Tk 1.637 million/day under constant load. Wear-aware operation increases the electricity bill to Tk 1.526 million but lowers the assumed wear reserve by Tk 9,000/day relative to the unrestricted schedule. Under the chosen Tk 200 wear valuation, the net daily margin is consequently Tk 1,281 lower than the unrestricted case. This reversal is substantively important: imposing conservative dynamic rules does not automatically maximize financial returns. Figure 4 shows the hourly electrical trajectories and the assumed PV opportunity, allowing the financial differences in Table 4 to be traced to actual operating times and plant setpoints.
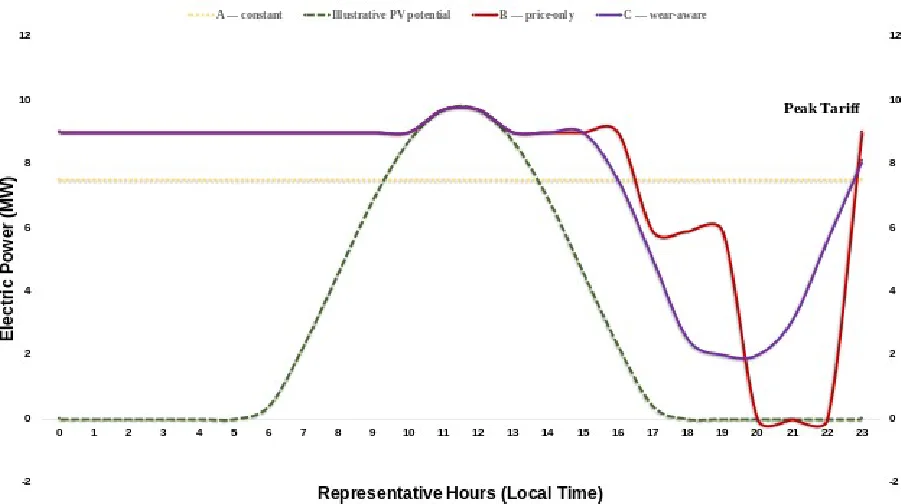
The unrestricted schedule runs near 9 MW through most off-peak hours before a 9 MW cyclic transition and three hours of shutdown during the evening peak. The wear-aware schedule reduces load progressively and remains online throughout the cycle, with a maximum 2.5 MW hourly movement. Constant operation neither exploits the tariff differential nor adjusts output to renewable availability.
5.3 Continuous hydrogen supply and storage feasibility (RO2)
Hydrogen-storage feasibility (RO2) is examined next because flexible electricity consumption must preserve the contracted hourly delivery schedule. Figure 5 displays the storage paths for both optimized cases against the stipulated capacity and terminal stock. Both meet 144.23 kg/h customer delivery and return to the starting 500 kg.
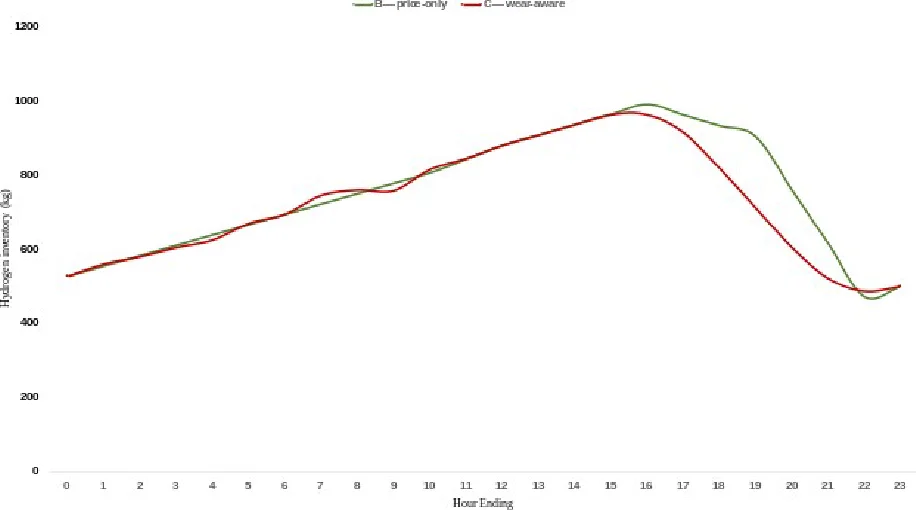
The unrestricted trajectory approaches the 1,000 kg tank limit before its evening shutdown, then releases stored hydrogen while production is interrupted. The wear-aware trajectory likewise charges inventory before the peak but discharges more gradually while maintaining low positive plant power. Under a smaller 250 kg store, both optimized strategies converge toward 36.59 MWh of evening grid consumption. Relative to the 1,000 kg benchmark, electricity expenditure increases by approximately Tk 65,577/day for unrestricted dispatch and Tk 55,296/day for wear-aware dispatch. The additional expenditure identifies the operational value of inventory capacity, but omits its capital and compression costs.
5.4 Degradation exposure, lifetime proxies, and grid withdrawals (RO1–RO3)
The operating comparison (RO1–RO3) distinguishes wear-related exposure from peak-grid effects, separately from the financial balance. Table 5 identifies starts, load variation, renewable utilizations, and peak withdrawals under identical delivery requirements.
Table 5. Physical Exposure and Hourly Grid Metrics Under Three Counterfactuals.
| Operation | Starts/day | Max ramp MW/h | High-load h | Exposure units | Peak grid MWh | PV used MWh |
|---|---|---|---|---|---|---|
| A — Steady | 0 | 0.00 | 0 | 24.00 | 44.54 | 58.84 |
| B — Price | 1 | 9.00 | 2 | 107.86 | 17.49 | 65.75 |
| C — Wear | 0 | 2.50 | 2 | 62.86 | 19.92 | 65.75 |
Relative to unrestricted dispatch, wear-aware control decreases the exposure index from 107.86 to 62.86 units, a 41.7% reduction, and eliminates the daily start. If an identical hypothetical damage budget were depleted linearly with that index, the implied relative service-duration factor would be 1.72, not a calibrated prediction of stack life. Wear-aware operation also reduces peak grid withdrawals by 55.3% relative to inflexible production, compared with 60.7% for the unrestricted case. Both optimised strategies consume all 65.75 MWh of modelled PV, whereas constant operation leaves 6.90 MWh unused on-site. Figure 6 examines the degradation valuation directly, comparing the preferred wear-aware schedule when its assumed price per wear unit changes; this plot tests whether the preferred operating trajectory is sensitive to a financial coefficient rather than to actual degradation measurements.
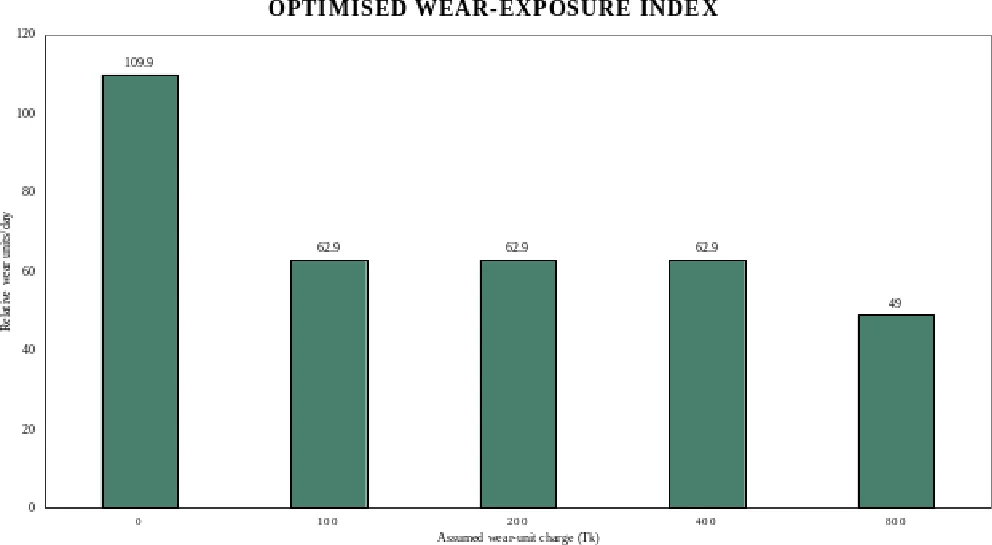
At zero assigned wear price, the selected schedule incurs 109.86 exposure units and includes a start; at Tk 100–400, the preferred exposure is approximately 62.86 units. At Tk 800, it falls to 48.99 units while procurement expenditure rises.
5.5 Conditions controlling comparative benefits (RO3)
To address RO3, the scenario analysis tests whether policy rankings depend on electricity prices, available solar generation and contracted hydrogen demand. Table 6 presents selected factorial contrasts, while the full 27-setting source table remains available in the supplementary workbook.
Table 6. Selected Sensitivity Contrasts from The Complete 27-Setting Factorial.
| Scenario contrast | Factors: demand / PV / price | C − B margin Tk/d | C peak-grid MWh | C PV uptake MWh |
|---|---|---|---|---|
| Central | D×1.0 PV×1.0 P×1.0 | -1,281 | 19.92 | 65.7 |
| Lower grid charges | D×1.0 PV×1.0 P×0.8 | +775 | 19.92 | 65.7 |
| Higher grid charges | D×1.0 PV×1.0 P×1.3 | -4,365 | 19.92 | 65.7 |
| High PV availability | D×1.0 PV×1.3 P×1.0 | +1,274 | 18.61 | 77.4 |
| Lower hydrogen offtake | D×0.8 PV×1.0 P×1.0 | +728 | 9.28 | 65.7 |
| High hydrogen offtake | D×1.2 PV×1.0 P×1.0 | -0 | 53.54 | 65.7 |
| Most positive C−B | D×0.8 PV×1.3 P×0.8 | +7,386 | 9.14 | 73.4 |
| Most negative C−B | D×0.8 PV×0.4 P×1.0 | -9,603 | 9.56 | 26.3 |
The stronger the assumed grid tariff relative to PV procurement, the greater the monetary importance of shifting grid purchases; nevertheless, the optimal cost of imposing ramp and start limits also changes. Under base demand and solar, reducing the tariff vector by 20% makes the wear-aware margin exceed the unrestricted margin by Tk 775/day, whereas a 30% tariff increase makes it lower by Tk 4,365/day. Under high hydrogen demand, comparable schedules frequently converge because required utilisation leaves little dispatch discretion.
Figure 7 visualises all 27 factorial contrasts, comparing the C–B contribution-margin difference (Tk/day) across tariff, PV-availability and hydrogen-demand settings.
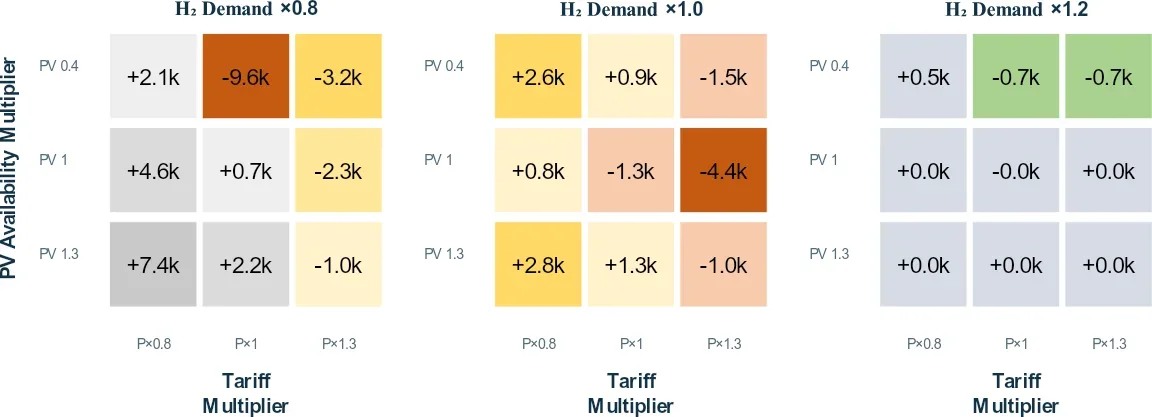
Wear-aware operation yields the higher modelled contribution margin in 11 combinations, ties to rounding in six, and is lower in ten. The largest positive contrast is approximately Tk 7,386/day under low hydrogen demand, high assumed PV availability, and lower grid charges. The most negative reaches approximately Tk 9,603/day under low demand, low PV availability, and the central price vector.
5.6 Scope of the inferred grid and lifetime outcomes
The final analysis distinguishes calculated operating indicators from grid and lifetime outcomes that require independent verification. Avoided evening grid purchases represent a traceable, model-internal load-shifting metric; they do not measure reduced loss-of-load probability, reserve activation, avoided emissions, or network congestion costs. Likewise, the wear index evaluates exposure to chosen operational events but does not estimate voltage rise, irreversible catalyst loss, or calendar stack life. Grid-service remuneration would additionally require independent dispatch instructions, metered counterfactual baselines, response telemetry, and settled performance records. None is supplied by the historical tariff.
6. Discussion
The main message is that the flexibility of the grid is not only due to the rated capacity of the electrolyser, but also depends on the coordination of production and inventory decisions. The hydrogen-delivery condition makes this distinction real: If enough gas is produced earlier and stored without crossing the tank boundary, then a scheduled evening shutdown is still possible. This is in line with the sector coupling studies that integrate hydrogen assets in an intertemporal electricity procurement and downstream demand system (Stöckl et al., 2021). It is a tariff-only screening analysis that includes hydrogen mass balance and partial-load conversion, but is not as comprehensive as network-dispatch and plant-dynamics models.
The direction of the electricity-cost savings observed is consistent with the results found in the literature for price-responsive hydrogen production (Glenk & Reichelstein, 2019). The comparison also shows why a price-only optimum is not operationally complete, however. The wear-agnostic case is able to extract more tariff value by moving relatively abruptly, and the wear-aware control reduces starts and movement at a relatively small additional grid cost. This trade-off is consistent with the research that has been done on the relationship between dynamic PEM operation and ageing mechanisms and lifecycle economic impacts (Zhang & Yuan, 2022). Importantly, the cost penalty is larger than the hypothetical saving in damage reserves in the central case.
Therefore, the resulting daily margin ranking is not hidden behind a presumption of the narrative that conservative operation is always profitable. The relative economic benefits of wear-aware dispatch are not necessarily present in all scenarios, as suggested by the factorial scenarios. For certain electricity prices and solar configurations, the savings in proxy wear cost from avoiding starts and ramps is enough to cover the cost of procurement penalties. In other settings, particularly those with a high opportunity for electricity prices, the higher assumed contribution margin remains. The higher the demand for hydrogen, the more the feasible flexibility envelope is reduced as more hydrogen is produced during the high-cost hours. This pattern supports the conclusion that policy incentives and equipment warranties need to be assessed jointly, not by adding an arbitrary degradation surcharge to a predetermined schedule.
There are two findings that need to be exercised with caution. First, the exposure index is a deliberate linear proxy that is transparent. The actual degradation of PEM is multidimensional, path-dependent, and dependent on the thermal, chemical, and materials conditions. Experimental voltage trajectories are required prior to the conversion of the index to replacement intervals or recognised project costs. Second, the use of renewable electricity at the plant does not mean that there are no carbon emissions or true avoided curtailment. The interpretation of grid-connected hydrogen is significantly different when considering temporal renewable matching, generator additionality and hourly emissions accounting (Giovanniello et al., 2024). The PV source in this instance is an assumed local supply profile, while the rest of the grid purchases do not have a known source of generation and thus cannot be used to support a certified green-hydrogen claim.
Another limitation, having a direct methodological implication, is the institutional context in Bangladesh. The historic industrial peak/off-peak tariffs are not a day-ahead auction, locational marginal price, reserve-capacity offer, or balancing-market settlement. Existing stochastic bidding models are based on contracts and market products that have explicit settlement specifications (Rezaee Jordehi et al., 2024). The present study, however, presents a technically limited electricity-purchase schedule and its conditionally operating value. The formulation would have to be transferred to a competitive market, which would involve having verified rules for bids, activation probabilities, telemetry requirements, imbalance payments, and opportunity cost of flexibility capacity. Those variables would not exist if it were not for ancillary services.
The value of flexible dispatch is further moderated by the hydrogen-storage capacity. An increase in the hypothetical store from 250kg to 1000kg decreases the modelled evening withdrawals and allows for more electricity shifting without impacting contracted deliveries. This interaction implies that intertemporal hydrogen storage is an operational flexibility asset that has cost and reliability characteristics that fall within the investment decision, rather than outside of it. Thus, the integrated model can be viewed as a pre-investment design and sensitivity tool. It sets out the technical measurements and contract terms that have leverage over conclusions, and it notes the need for hydrogen storage to complement flexible power consumption, and where modelling by the manufacturers would enhance the validity.
It also provides a clear platform for benchmarking pilot sites prior to unverified claims of longevity of the stack or benefits to the national grid. More general applicability requires the use of observed operating and price series instead of proxy inputs and the assessment of annual seasonal variation instead of extrapolation of one representative day.
7. Conclusion
In this study, grid-flexibility resource green-hydrogen electrolysis was assessed by simultaneously modeling load-dependent conversion, hydrogen delivery, and operating controls related to degradation. A stylized 10 MW PEM plant was connected to the historically published 2024 industrial peak/off-peak tariff in Bangladesh, a clearly assumed PV source, and a cyclic hydrogen store, in a deterministic mixed-integer model. Three counterfactual operating rules were tested with the same daily delivery requirements and extended to a 27-setting factorial of electricity prices, renewable availability, and hydrogen demand. The results presented in the model indicate that the electricity cost is minimized with no restriction on flexibility, while the electricity cost is reduced with wear-aware scheduling, but with a compromise in terms of the reduction of the peak electricity load on the grid.
All base strategies provide 3,461.54 kg/day, while the wear-aware case decreases peak grid withdrawals from 44.54 to 19.92 MWh, and decreases the assumed degradation-exposure index by 41.7% compared to price-only dispatch. However, its illustrative contribution margin is Tk 1,281/day less than in the unrestricted case. Comparisons of scenarios show no overall financial ranking. The main contribution is an auditable physical–economic integration whose limits of identification are still explicit. The electricity tariff is historical; efficiency, PV output, wear valuation, and hydrogen price are scenario assumptions. Reported lifetime ratios are index-based, not measured years; peak-shifting metrics are not proven grid welfare gains. Future work should include hourly market and renewable records, technology-specific voltage degradation calibration, real delivery profiles, and independently verified settlement and emissions accounting.
Numerical lifetime and grid-welfare predictions are not within the scope of this study until these inputs are measured.
8. Recommendations
The pilot operators need metered hourly electrolyser power, hydrogen production, stack voltage, water quality, temperature, pressure, intervention for maintenance, and start/stop history. With these measurements, the assumption of a piecewise function and a wear index could be calibrated and replaced by calibrated damage functions. Reporting of manufacturer warranty limits must be made explicit for the cycling, voltage drift, temperature excursion, and part-load limits. Project developers also need independently costed hydrogen storage and compression, because the current model assumes that storage is a part of peak avoidance and is reliable. The price of the response service and the price of the formally purchased response service must be distinguished by the tariff and procurement authorities.
The terms of flexible electrolysis contracts should be specific on how to respond, availability thresholds, additional compensation for dynamic use, and accurate settlement and verification rules. Whilst more hydrogen absorption via PV means more renewable hydrogen claims, network curtailment does not necessarily follow. First, research teams need full-year demand series, renewable-output series, and electricity-price series, and then comparisons of the results with out-of-sample data in realistic seasonal conditions, along with the results of the manufacturer-specific durability tests. A second investment analysis would also include equipment capital, stack replacement, demand charges, water treatment, storage losses, hydrogen price volatility, and quantified emissions. Until then, the results are not a good indicator of profit or lifetime predictions, but are only a scenario screening.
Author Contributions
Conceptualisation, model specification, formal analysis, software, validation, visualisation, and manuscript drafting are documented in the accompanying reproducibility package. Author identities and corresponding individual CRediT roles require confirmation before journal submission.
Conflict of Interest
The authors' actual competing-interest declarations require confirmation before submission; no declaration has been invented.
References
- Buttler, A., & Spliethoff, H. (2018). Current status of water electrolysis for energy storage, grid balancing and sector coupling via power-to-gas and power-to-liquids: A review. Renewable and Sustainable Energy Reviews, 82, 2440–2454. https://doi.org/10.1016/j.rser.2017.09.003
- Ghaemi, S., Li, X., & Mulder, M. (2023). Economic feasibility of green hydrogen in providing flexibility to medium-voltage distribution grids in the presence of local-heat systems. Applied Energy, 331, 120408. https://doi.org/10.1016/j.apenergy.2022.120408
- Giovanniello, M. A., Cybulsky, A. N., Schittekatte, T., & Mallapragada, D. S. (2024). The influence of additionality and time-matching requirements on the emissions from grid-connected hydrogen production. Nature Energy, 9(2), 197–207. https://doi.org/10.1038/s41560-023-01435-0
- Glenk, G., & Reichelstein, S. (2019). Economics of converting renewable power to hydrogen. Nature Energy, 4(3), 216–222. https://doi.org/10.1038/s41560-019-0326-1
- Lange, H., Klose, A., Lippmann, W., & Urbas, L. (2023). Technical evaluation of the flexibility of water electrolysis systems to increase energy flexibility: A review. International Journal of Hydrogen Energy, 48(42), 15771–15783. https://doi.org/10.1016/j.ijhydene.2023.01.044
- Martinez Lopez, V. A., Ziar, H., Haverkort, J. W., Zeman, M., & Isabella, O. (2023). Dynamic operation of water electrolyzers: A review for applications in photovoltaic systems integration. Renewable and Sustainable Energy Reviews, 182, 113407. https://doi.org/10.1016/j.rser.2023.113407
- Mößle, P., Herrmannsdörfer, T., Welzl, M., Brüggemann, D., & Danzer, M. A. (2025). Economic optimization for the dynamic operation of a grid connected and battery-supported electrolyzer. International Journal of Hydrogen Energy, 100, 749–759. https://doi.org/10.1016/j.ijhydene.2024.12.216
- Odenweller, A., Ueckerdt, F., Nemet, G. F., Jensterle, M., & Luderer, G. (2022). Probabilistic feasibility space of scaling up green hydrogen supply. Nature Energy, 7(9), 854–865. https://doi.org/10.1038/s41560-022-01097-4
- Papakonstantinou, G., Algara-Siller, G., Teschner, D., Vidaković-Koch, T., Schlögl, R., & Sundmacher, K. (2020). Degradation study of a proton exchange membrane water electrolyzer under dynamic operation conditions. Applied Energy, 280, 115911. https://doi.org/10.1016/j.apenergy.2020.115911
- Qiu, Y., Zhou, B., Zang, T., Zhou, Y., Chen, S., Qi, R., Li, J., & Lin, J. (2023). Extended load flexibility of utility-scale P2H plants: Optimal production scheduling considering dynamic thermal and HTO impurity effects. Renewable Energy, 217, 119198. https://doi.org/10.1016/j.renene.2023.119198
- Rabiee, A., Keane, A., & Soroudi, A. (2021). Green hydrogen: A new flexibility source for security constrained scheduling of power systems with renewable energies. International Journal of Hydrogen Energy, 46(37), 19270–19284. https://doi.org/10.1016/j.ijhydene.2021.03.080
- Rezaee Jordehi, A., Mansouri, S. A., Tostado-Véliz, M., Carrión, M., Hossain, M. J., & Jurado, F. (2024). A risk-averse two-stage stochastic model for optimal participation of hydrogen fuel stations in electricity markets. International Journal of Hydrogen Energy, 49, 188–201. https://doi.org/10.1016/j.ijhydene.2023.07.197
- Ricks, W., Xu, Q., & Jenkins, J. D. (2023). Minimizing emissions from grid-based hydrogen production in the United States. Environmental Research Letters, 18(1), 014025. https://doi.org/10.1088/1748-9326/acacb5
- Ruhnau, O., & Schiele, J. (2023). Flexible green hydrogen: The effect of relaxing simultaneity requirements on project design, economics, and power sector emissions. Energy Policy, 182, 113763. https://doi.org/10.1016/j.enpol.2023.113763
- Salam, M. A., Shaikh, M. A. A., Ahmed, K., Sweety, M. N., & Saha, P. (2024). Strategic integration of national grid or solar photovoltaic power with the on-site hydrogen vehicle refueling station at the hydrogen energy laboratory, BCSIR, Bangladesh. International Journal of Hydrogen Energy, 86, 153–165. https://doi.org/10.1016/j.ijhydene.2024.08.343
- Sayed-Ahmed, H., Toldy, Á. I., & Santasalo-Aarnio, A. (2024). Dynamic operation of proton exchange membrane electrolyzers—Critical review. Renewable and Sustainable Energy Reviews, 189, 113883. https://doi.org/10.1016/j.rser.2023.113883
- Shih, A. J., Monteiro, M. C. O., Dattila, F., Pavesi, D., Philips, M., Da Silva, A. H. M., Vos, R. E., Ojha, K., Park, S., Van Der Heijden, O., Marcandalli, G., Goyal, A., Villalba, M., Chen, X., Gunasooriya, G. T. K. K., McCrum, I., Mom, R., López, N., & Koper, M. T. M. (2022). Water electrolysis. Nature Reviews Methods Primers, 2(1), 84. https://doi.org/10.1038/s43586-022-00164-0
- Staffell, I., Scamman, D., Velazquez Abad, A., Balcombe, P., Dodds, P. E., Ekins, P., Shah, N., & Ward, K. R. (2019). The role of hydrogen and fuel cells in the global energy system. Energy & Environmental Science, 12(2), 463–491. https://doi.org/10.1039/C8EE01157E
- Stöckl, F., Schill, W.-P., & Zerrahn, A. (2021). Optimal supply chains and power sector benefits of green hydrogen. Scientific Reports, 11(1), 14191. https://doi.org/10.1038/s41598-021-92511-6
- Wallnöfer-Ogris, E., Grimmer, I., Ranz, M., Höglinger, M., Kartusch, S., Rauh, J., Macherhammer, M.-G., Grabner, B., & Trattner, A. (2024). A review on understanding and identifying degradation mechanisms in PEM water electrolysis cells: Insights for stack application, development, and research. International Journal of Hydrogen Energy, 65, 381–397. https://doi.org/10.1016/j.ijhydene.2024.04.017
- Walter, V., Göransson, L., Taljegard, M., Öberg, S., & Odenberger, M. (2023). Low-cost hydrogen in the future European electricity system – Enabled by flexibility in time and space. Applied Energy, 330, 120315. https://doi.org/10.1016/j.apenergy.2022.120315
- Wang, J., Wen, J., Wang, J., Yang, B., & Jiang, L. (2024). Water electrolyzer operation scheduling for green hydrogen production: A review. Renewable and Sustainable Energy Reviews, 203, 114779. https://doi.org/10.1016/j.rser.2024.114779
- Xu, B., Ma, W., Wu, W., Wang, Y., Yang, Y., Li, J., Zhu, X., & Liao, Q. (2024). Degradation prediction of PEM water electrolyzer under constant and start-stop loads based on CNN-LSTM. Energy and AI, 18, 100420. https://doi.org/10.1016/j.egyai.2024.100420
- Zhang, H., & Yuan, T. (2022). Optimization and economic evaluation of a PEM electrolysis system considering its degradation in variable-power operations. Applied Energy, 324, 119760. https://doi.org/10.1016/j.apenergy.2022.119760
CITE THIS ARTICLE
Rahman, M. S. (2026). Green Hydrogen as A Grid-Flexibility Resource: Degradation-Constrained Co-Optimization from Electrolyser Physics to Power Markets. https://www.researchbyshahriyar.com/article/7f1d064a-51fd-44fe-96f6-c2510c588c8b
M. S. Rahman, “Green Hydrogen as A Grid-Flexibility Resource: Degradation-Constrained Co-Optimization from Electrolyser Physics to Power Markets,” 2026. [Online]. Available: https://www.researchbyshahriyar.com/article/7f1d064a-51fd-44fe-96f6-c2510c588c8b
Rahman, M. S. (2026) ‘Green Hydrogen as A Grid-Flexibility Resource: Degradation-Constrained Co-Optimization from Electrolyser Physics to Power Markets’. Available at: https://www.researchbyshahriyar.com/article/7f1d064a-51fd-44fe-96f6-c2510c588c8b
Rahman, Md. Shahriyar. “Green Hydrogen as A Grid-Flexibility Resource: Degradation-Constrained Co-Optimization from Electrolyser Physics to Power Markets.” 2026, https://www.researchbyshahriyar.com/article/7f1d064a-51fd-44fe-96f6-c2510c588c8b.
Md. Shahriyar Rahman. “Green Hydrogen as A Grid-Flexibility Resource: Degradation-Constrained Co-Optimization from Electrolyser Physics to Power Markets.” (2026). https://www.researchbyshahriyar.com/article/7f1d064a-51fd-44fe-96f6-c2510c588c8b.
Rahman MS. Green Hydrogen as A Grid-Flexibility Resource: Degradation-Constrained Co-Optimization from Electrolyser Physics to Power Markets. 2026. https://www.researchbyshahriyar.com/article/7f1d064a-51fd-44fe-96f6-c2510c588c8b
@misc{article_7f1d064a51fd44fe96f6c2510c588c8b,
  title = {Green Hydrogen as A Grid-Flexibility Resource: Degradation-Constrained Co-Optimization from Electrolyser Physics to Power Markets},
  author = {Md. Shahriyar Rahman},
  year = {2026},
  url = {https://www.researchbyshahriyar.com/article/7f1d064a-51fd-44fe-96f6-c2510c588c8b},
}
TY - GEN AU - Md. Shahriyar Rahman TI - Green Hydrogen as A Grid-Flexibility Resource: Degradation-Constrained Co-Optimization from Electrolyser Physics to Power Markets PY - 2026 UR - https://www.researchbyshahriyar.com/article/7f1d064a-51fd-44fe-96f6-c2510c588c8b ER -